Currently attempting to do my stats assignment using 'R' statistical environment. I really do
wish I understood it, but I don't, in fact I am so far behind I think I'd like to cry right about now... Anyway. I'm currently in the middle of assessing the intercorrelation between variables and removing those which
are intercorrelated since they can obviously affect the outcome. I need to do this by looking at the correlation coefficients of all variables and looking at the VIF (Variance Inflation Factors). That's fine, except according to Zuur et al. (2010) (I think?) we should be removing all with a VIF score > 5 (and a Pearson's Coeff of > 0.7) - at the moment, there ARE no variables with a VIF score of < 5 so that scares me a little. Of course, once I start removing the really large VIF-score variables the others should come down... We shall see.
I find the large scatterplot matrix pretty scary to look at - there's just so much going on!
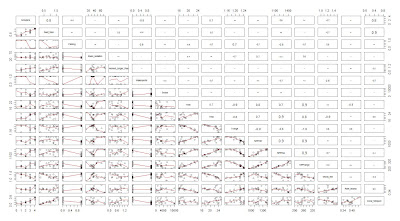 |
| Scatterplot matrix produced in 'R' |
Success, just removed the first thing... Groupers... since it is my
response variable and VIF scores have decreased a lot. Just need to do the rest now...

No comments:
Post a Comment